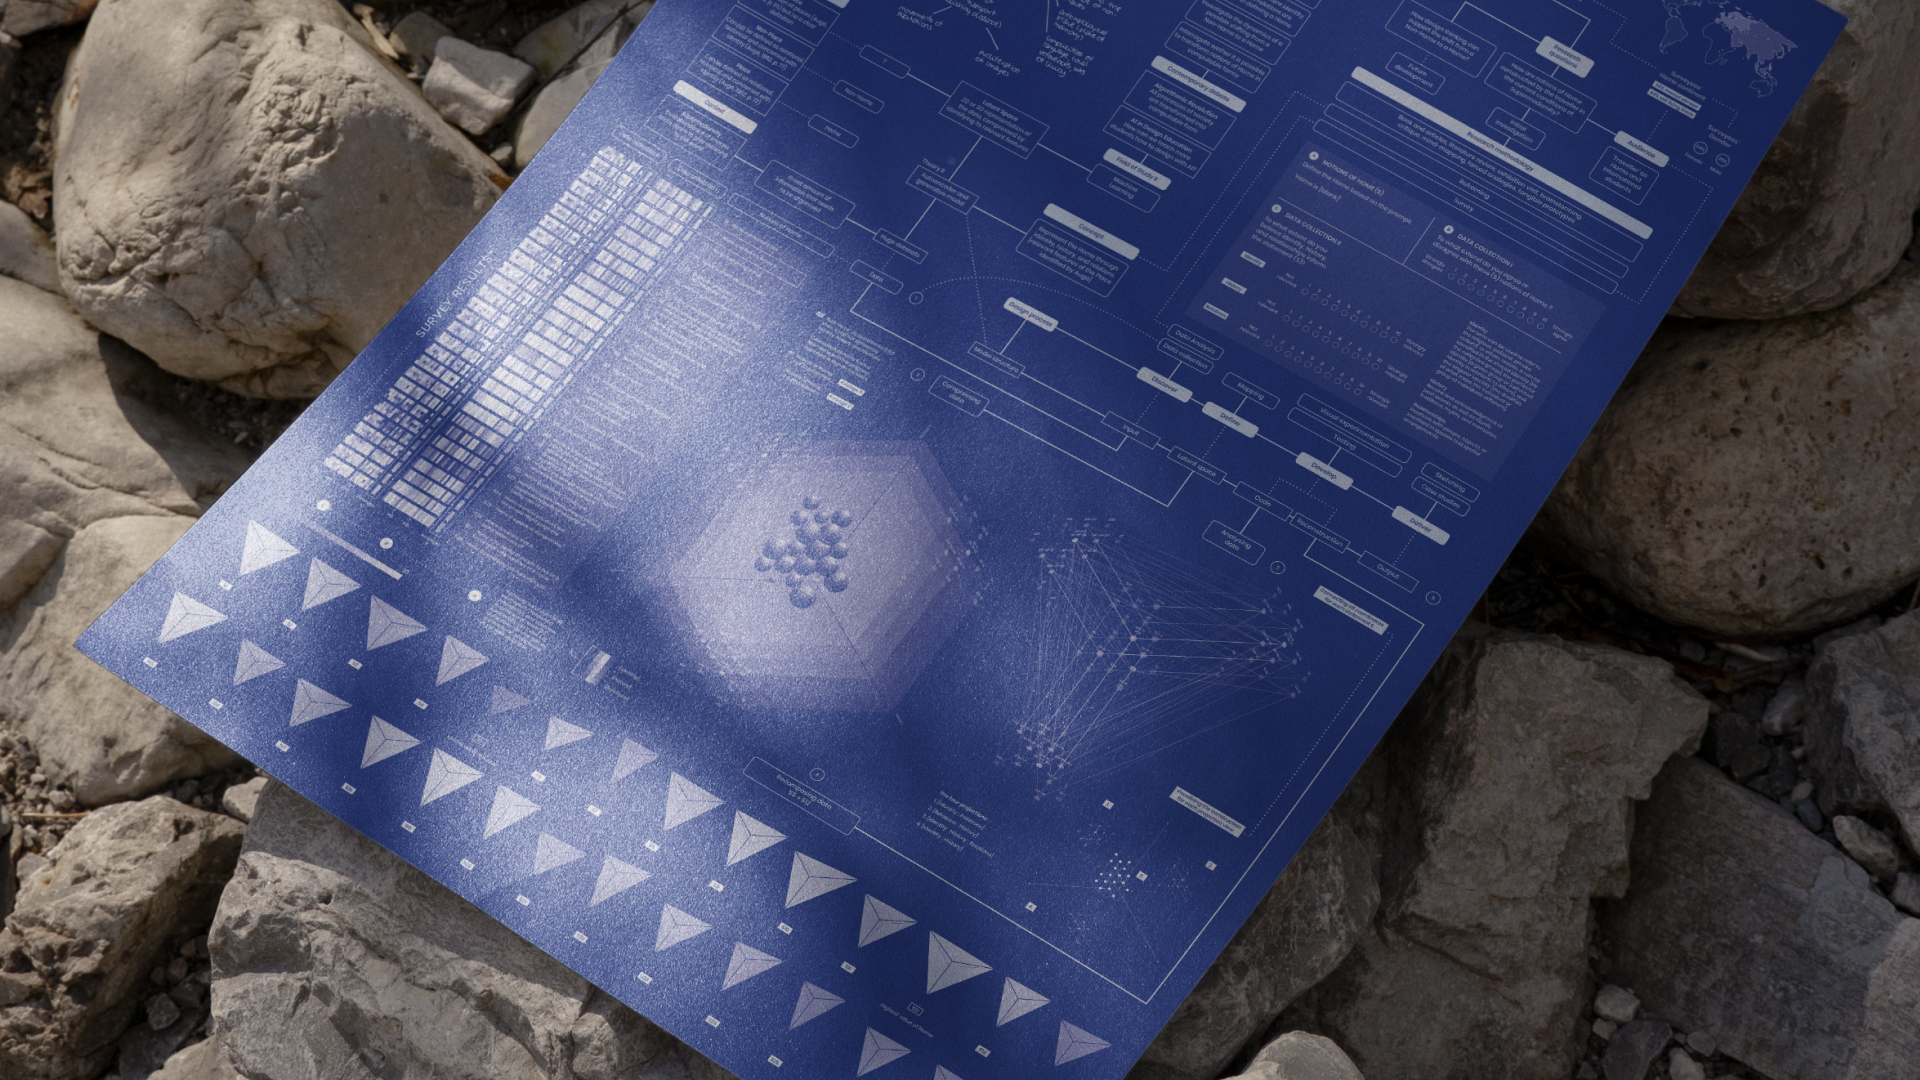
Blueprint of the Constructions of Notions of Home
Drawing from quantitative and qualitative research, this project explores how identity, history, and relationships shape the meaning of home. Using the Double Diamond design framework and inspired by machine learning models, it visualizes patterns in how people experience home while also demonstrating a method for exploring other complex, subjective ideas through design and data visualization.
Problem
Home is often considered a universal concept, yet it is subjective and constantly changing. For international students, it can feel fragmented or unstable, particularly in times of crisis such as the COVID-19 pandemic. This project set out to explore how home is constructed and to turn that process into a visual model that others can objectively understand.
Research
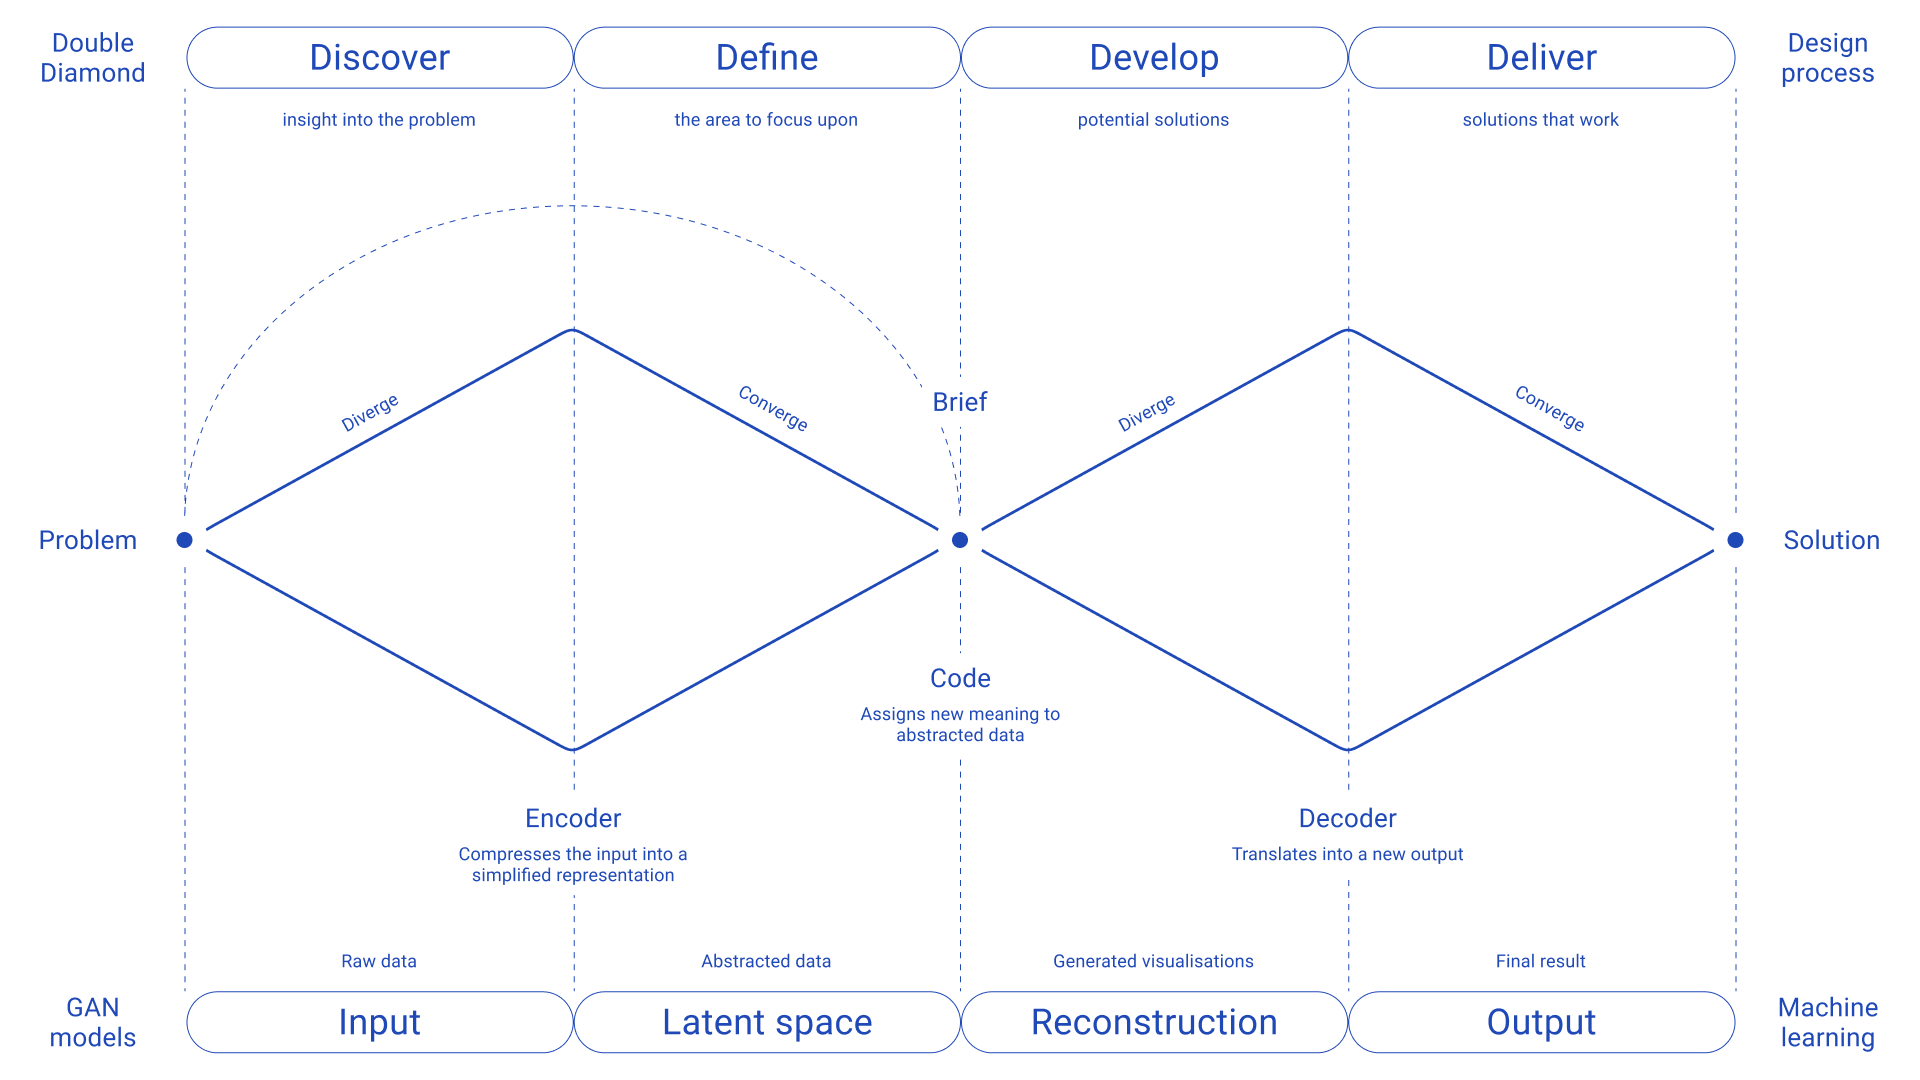
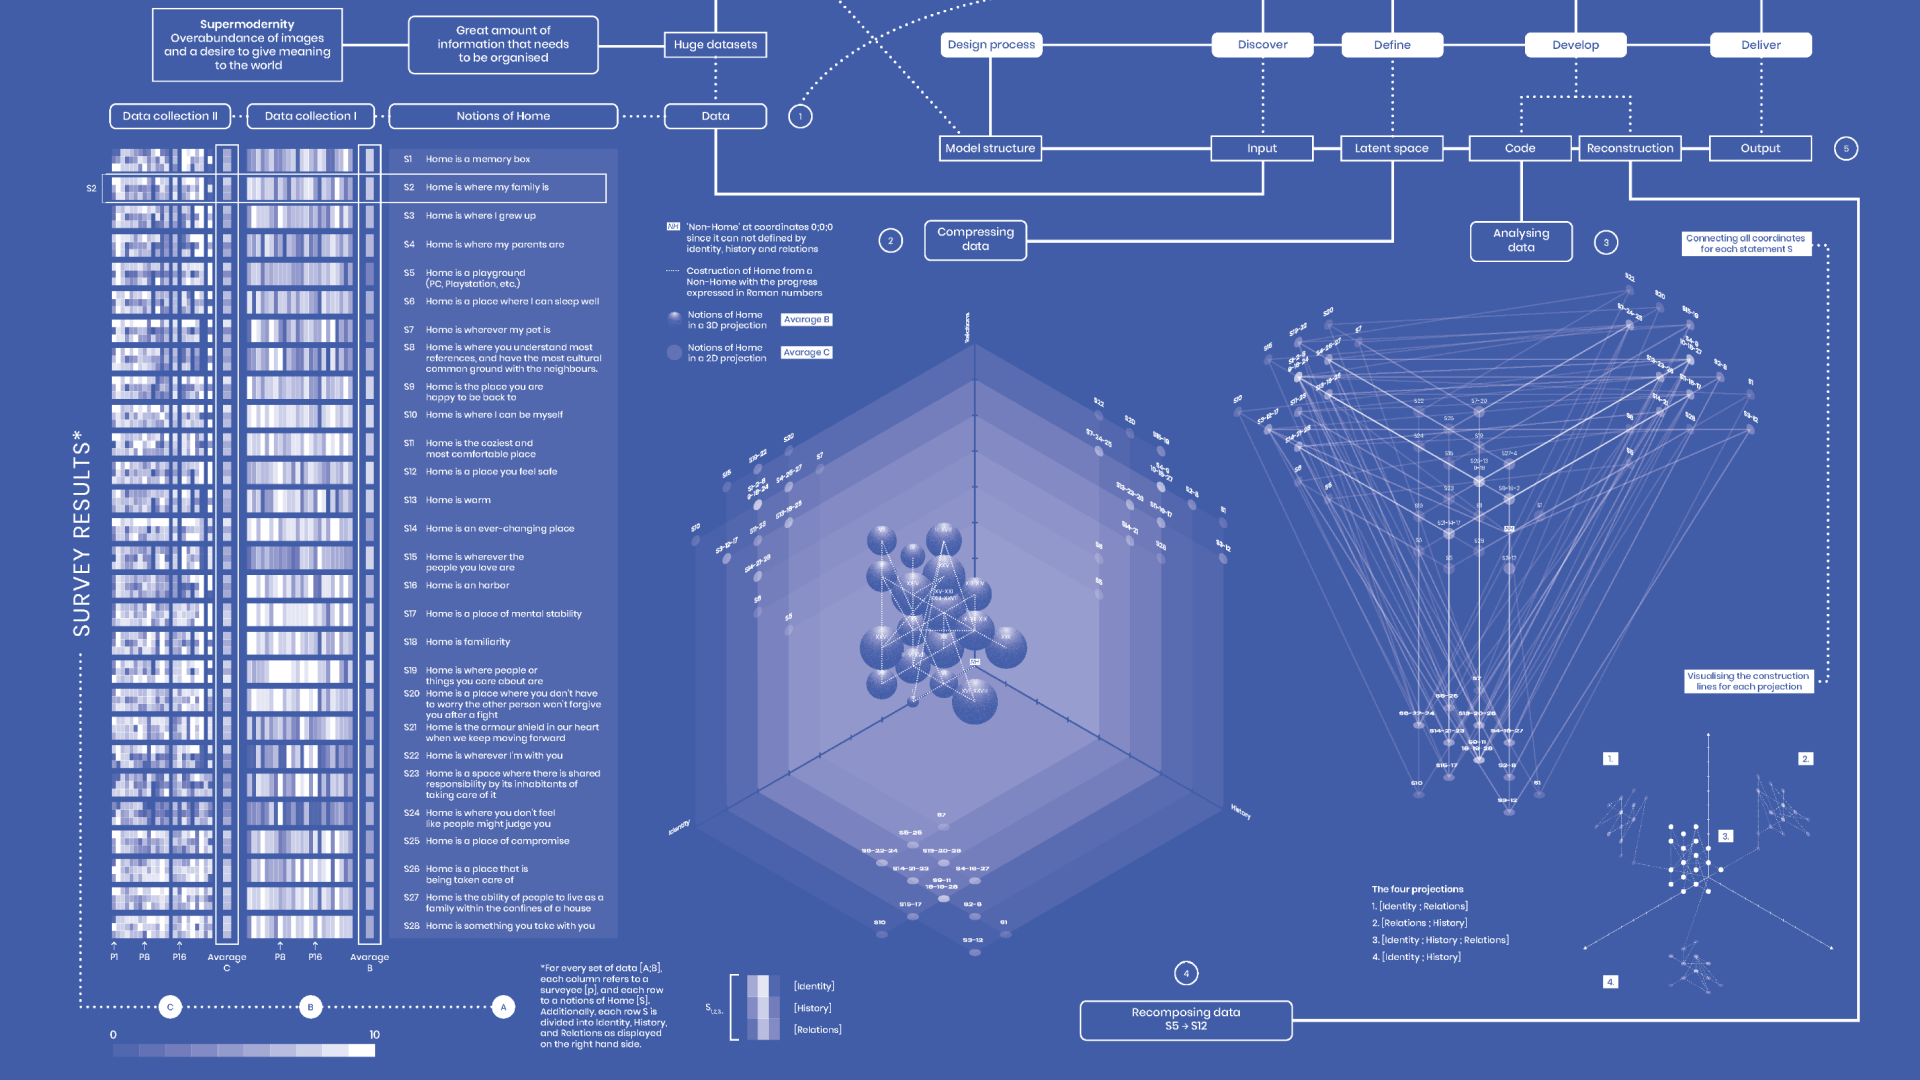
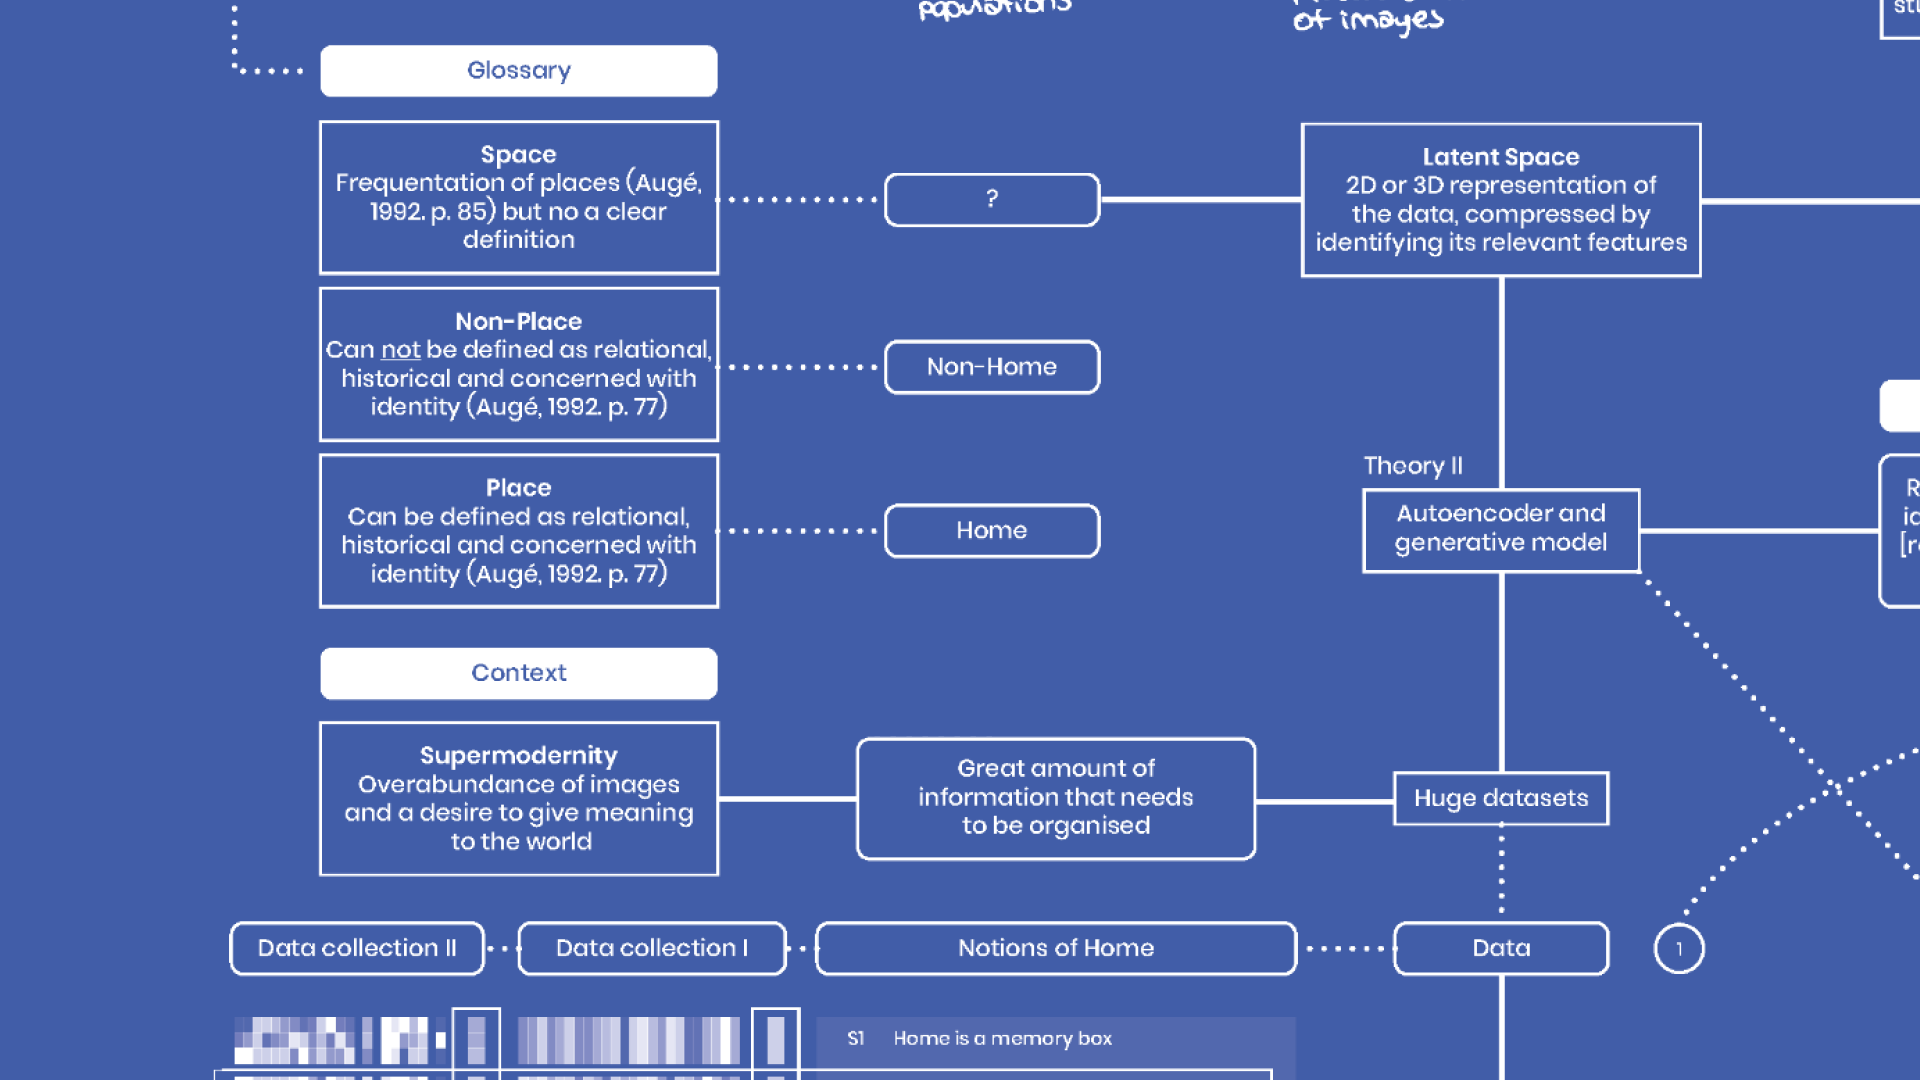
The project followed the Double Diamond design process, providing a clear structure to move from broad exploration to focused delivery. In the Discover phase, a review of psychology, sociology, architecture, and anthropology established the theoretical foundation. Marc Augé’s concept of “non-places” became central to framing the problem and helped identify three dimensions that influence how home is experienced: identity, history, and relationships.
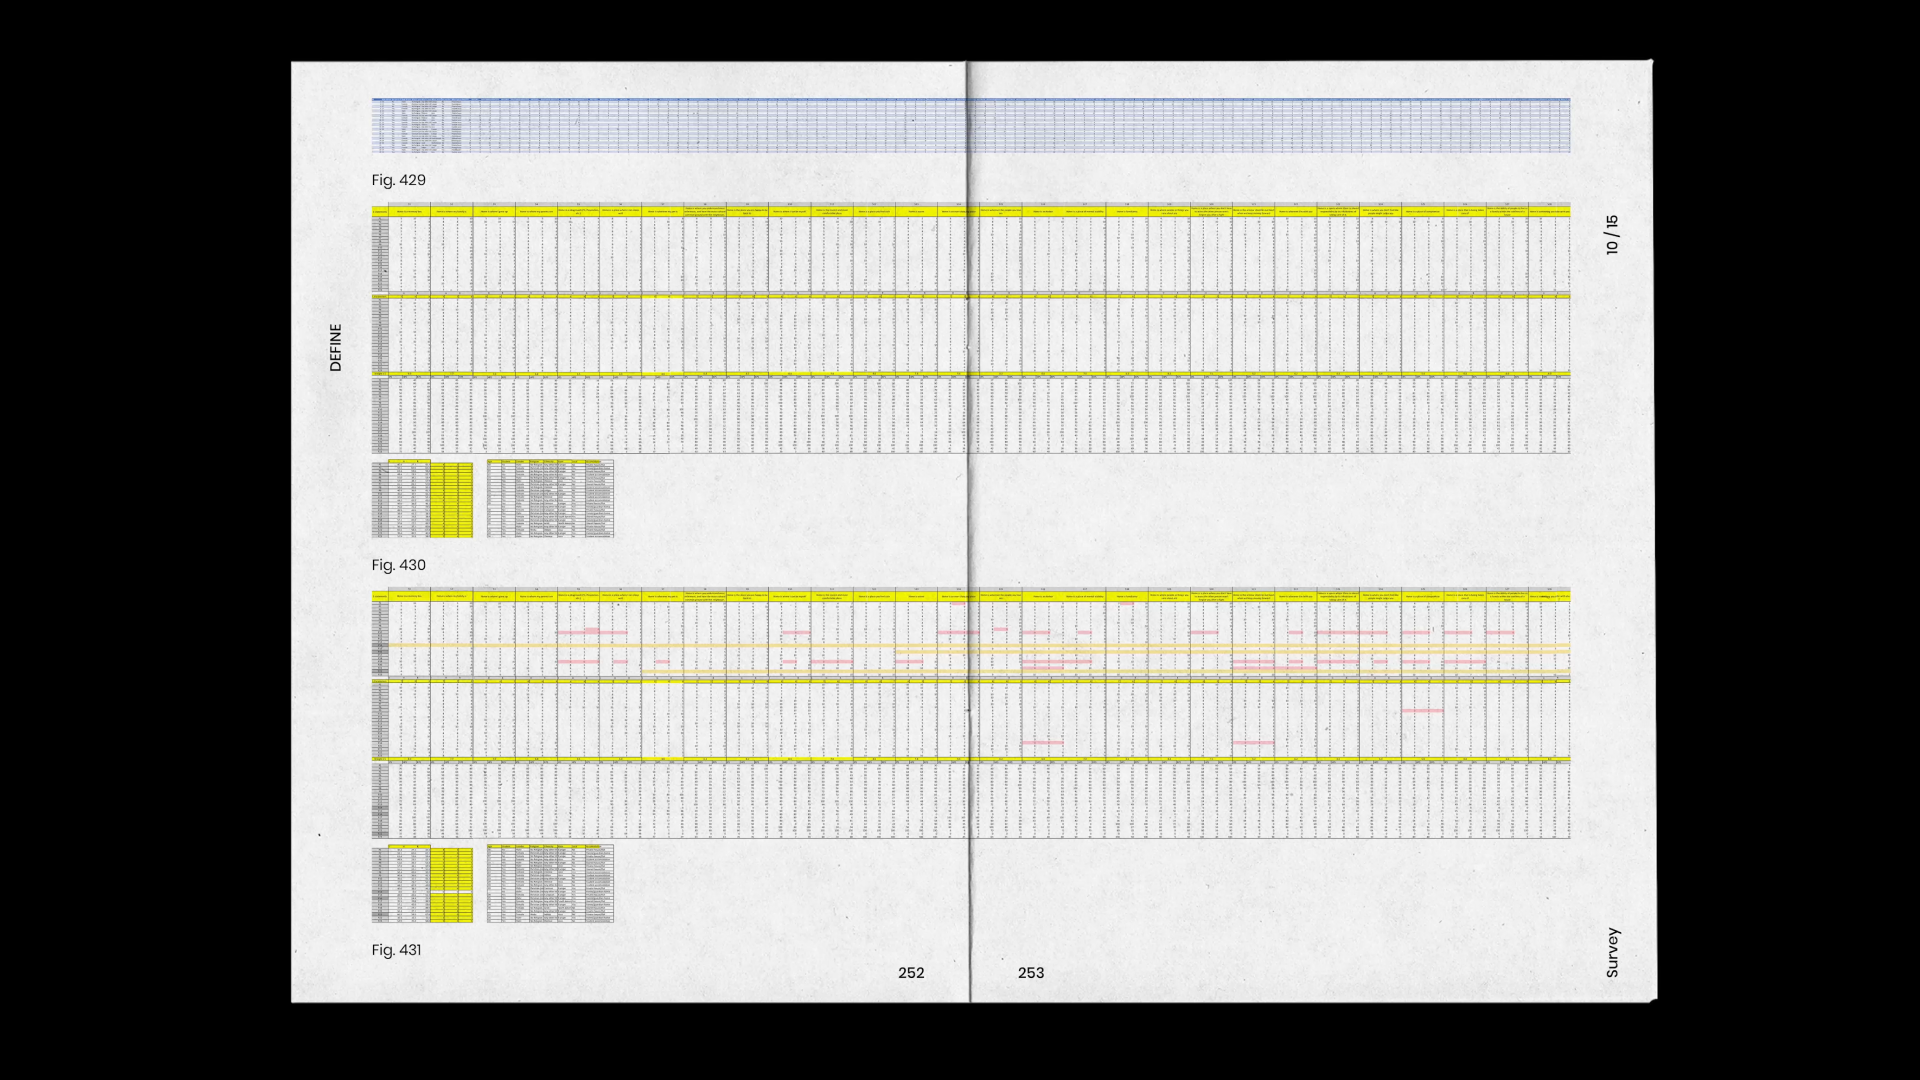
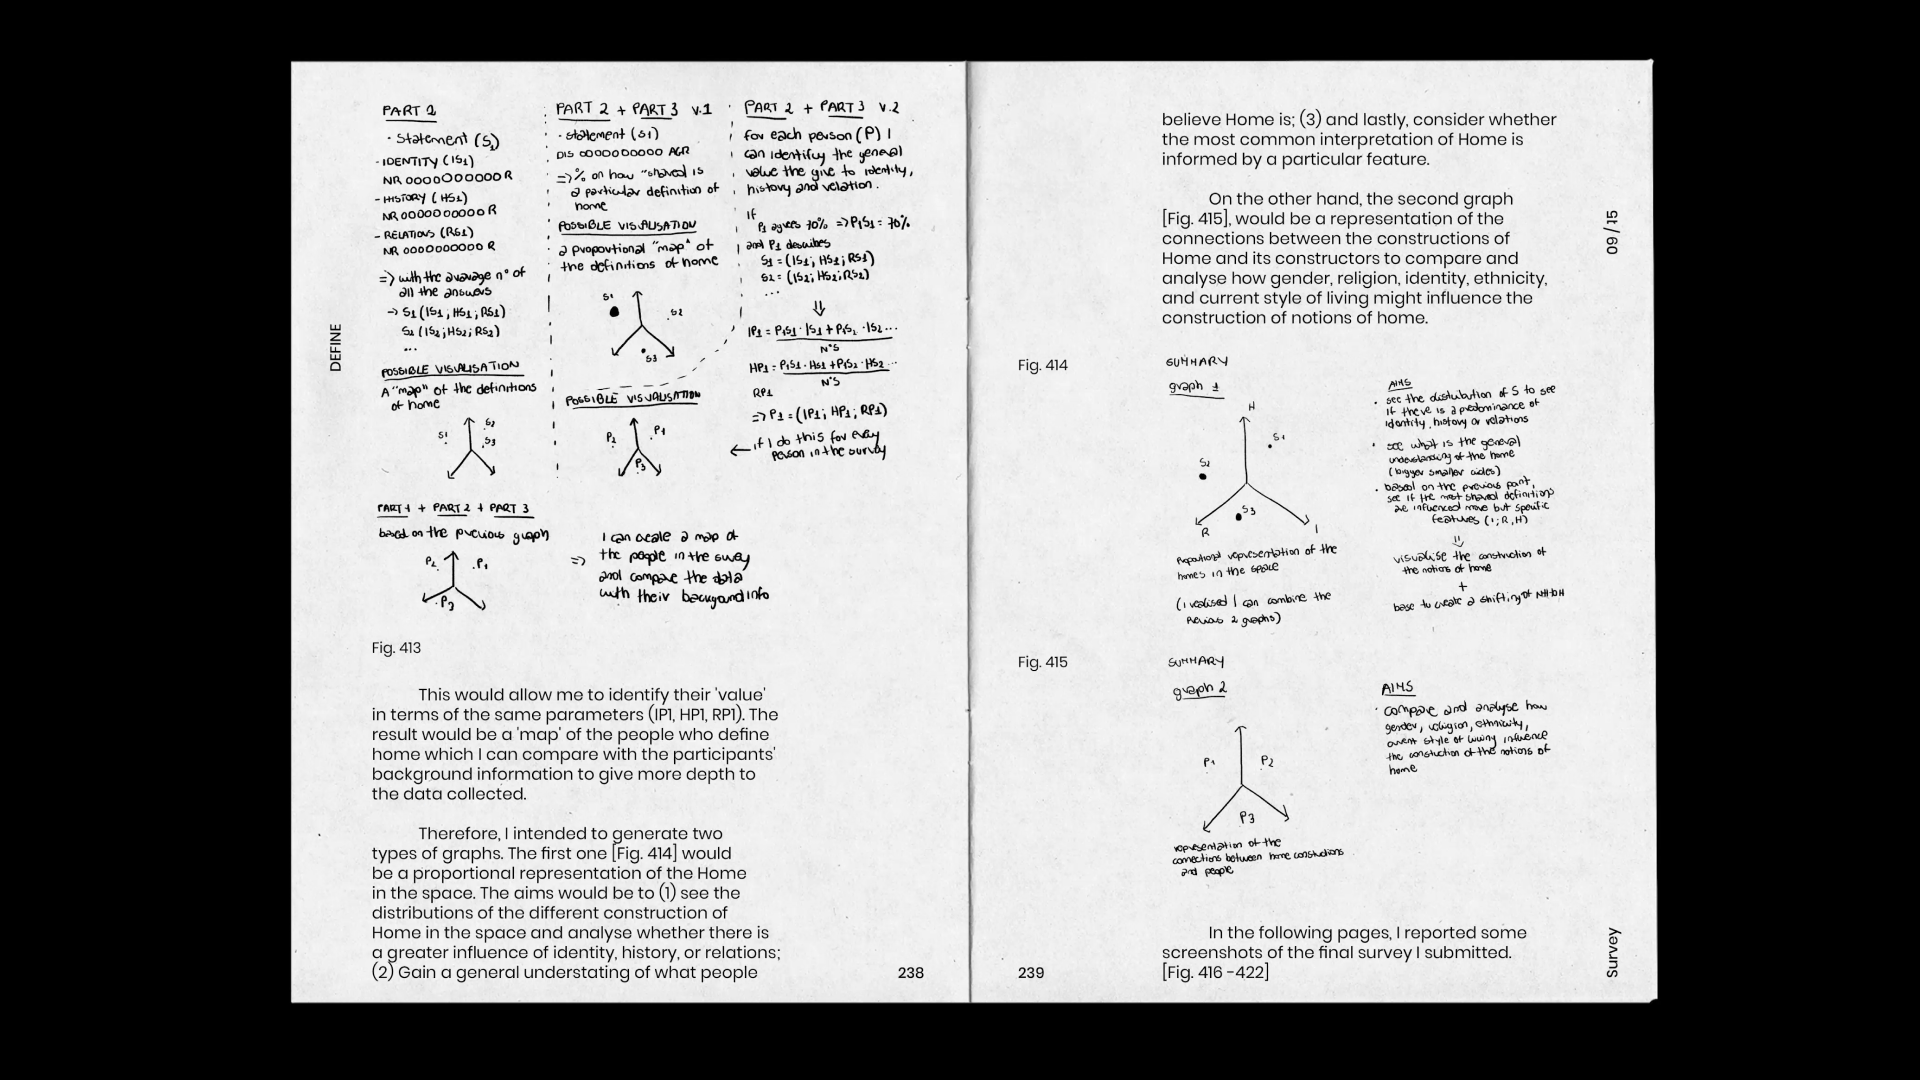
During the Define phase, these dimensions were transformed into measurable parameters. Survey responses about home were analyzed and categorized along these dimensions, forming the dataset for visual mapping.
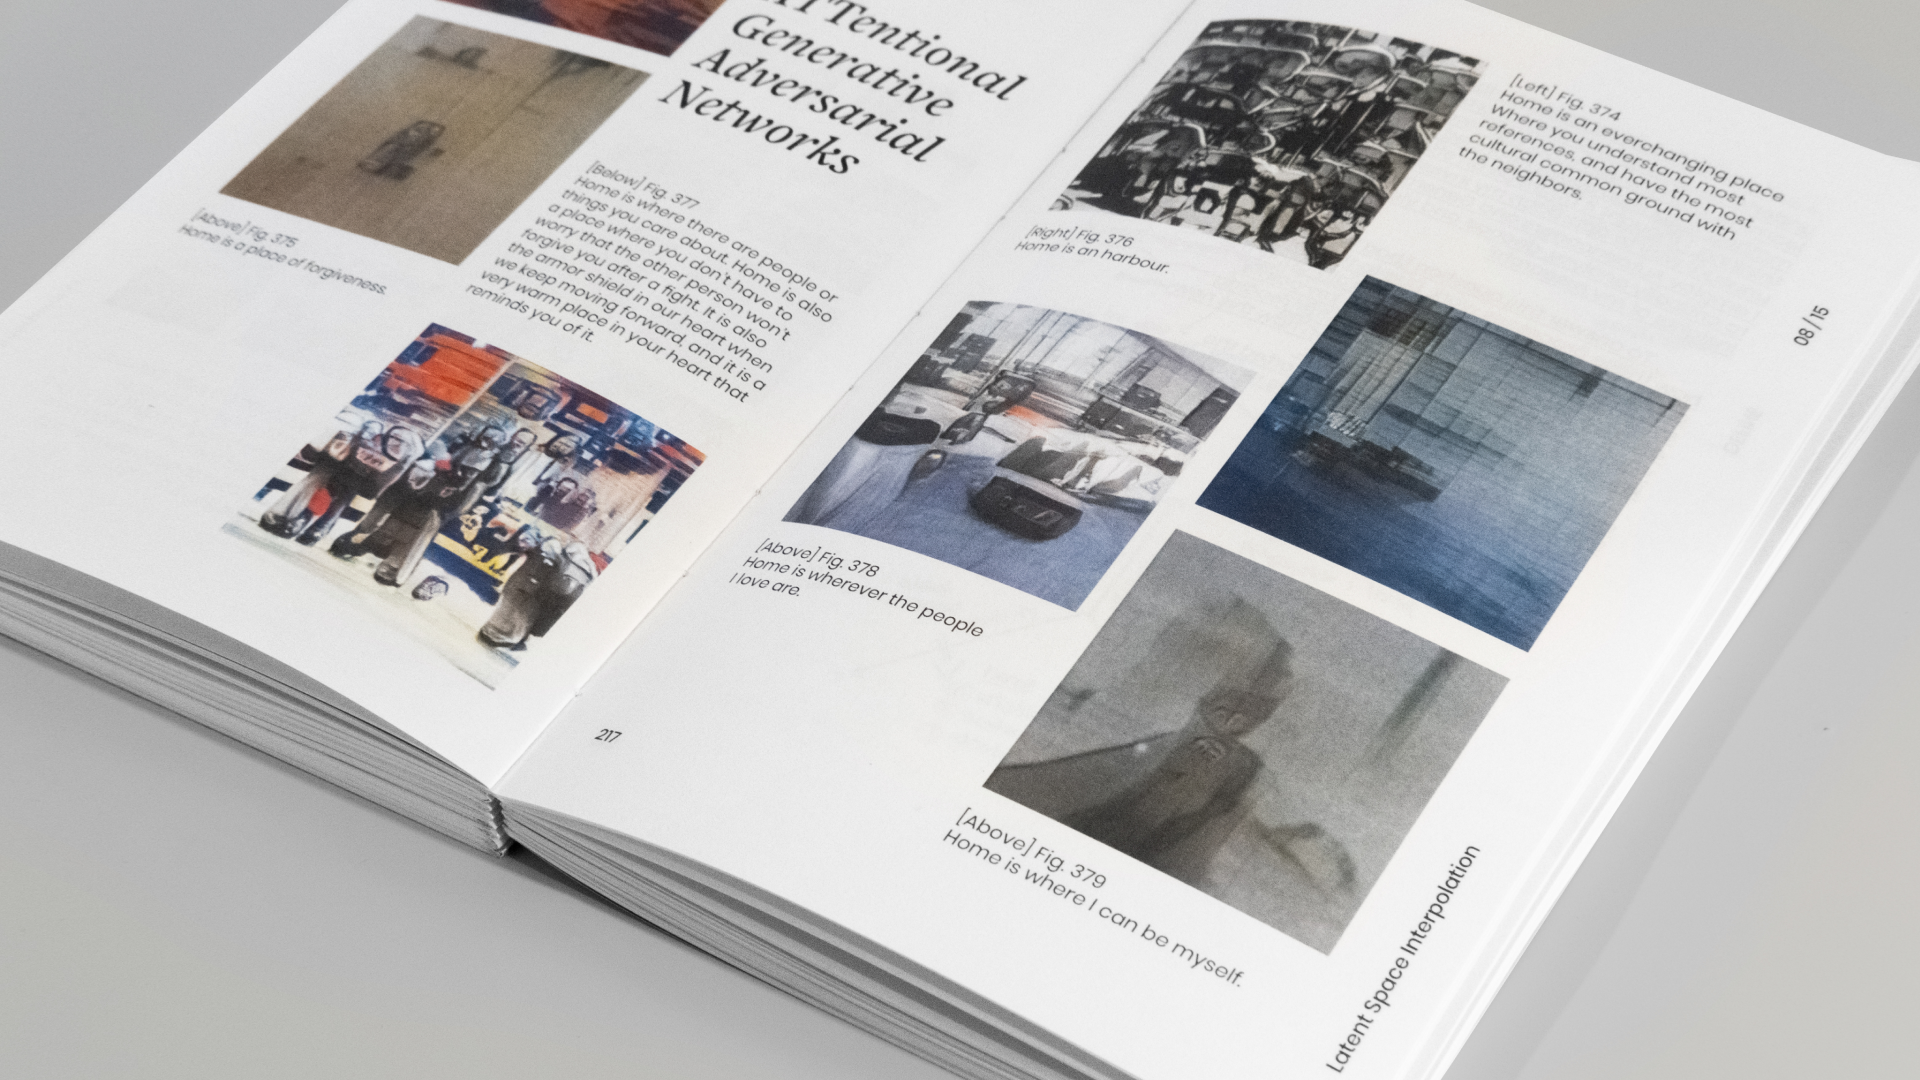
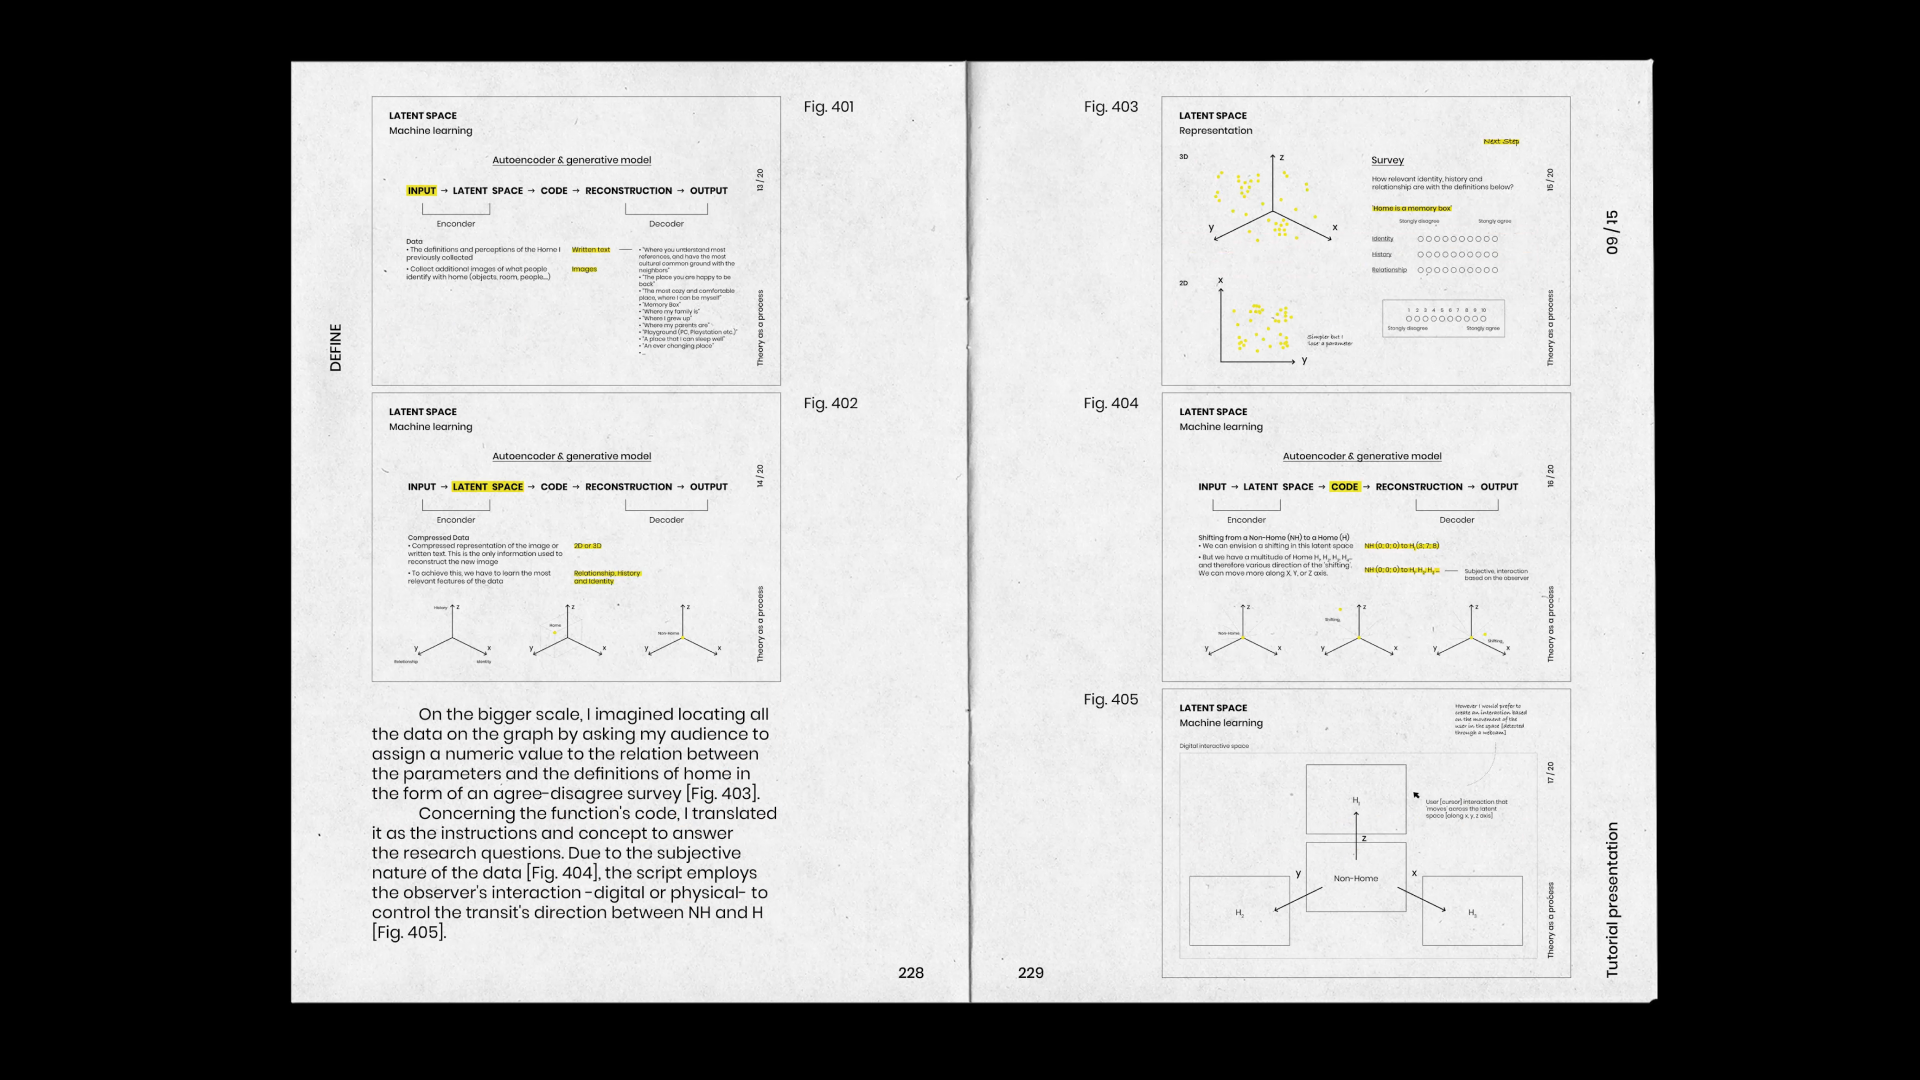
To conceptualize and process the data, a machine learning-inspired analogy was applied. Responses were treated as “inputs,” encoded along the three dimensions, compressed into a conceptual “latent space,” and decoded into a 3D visualization.
Development
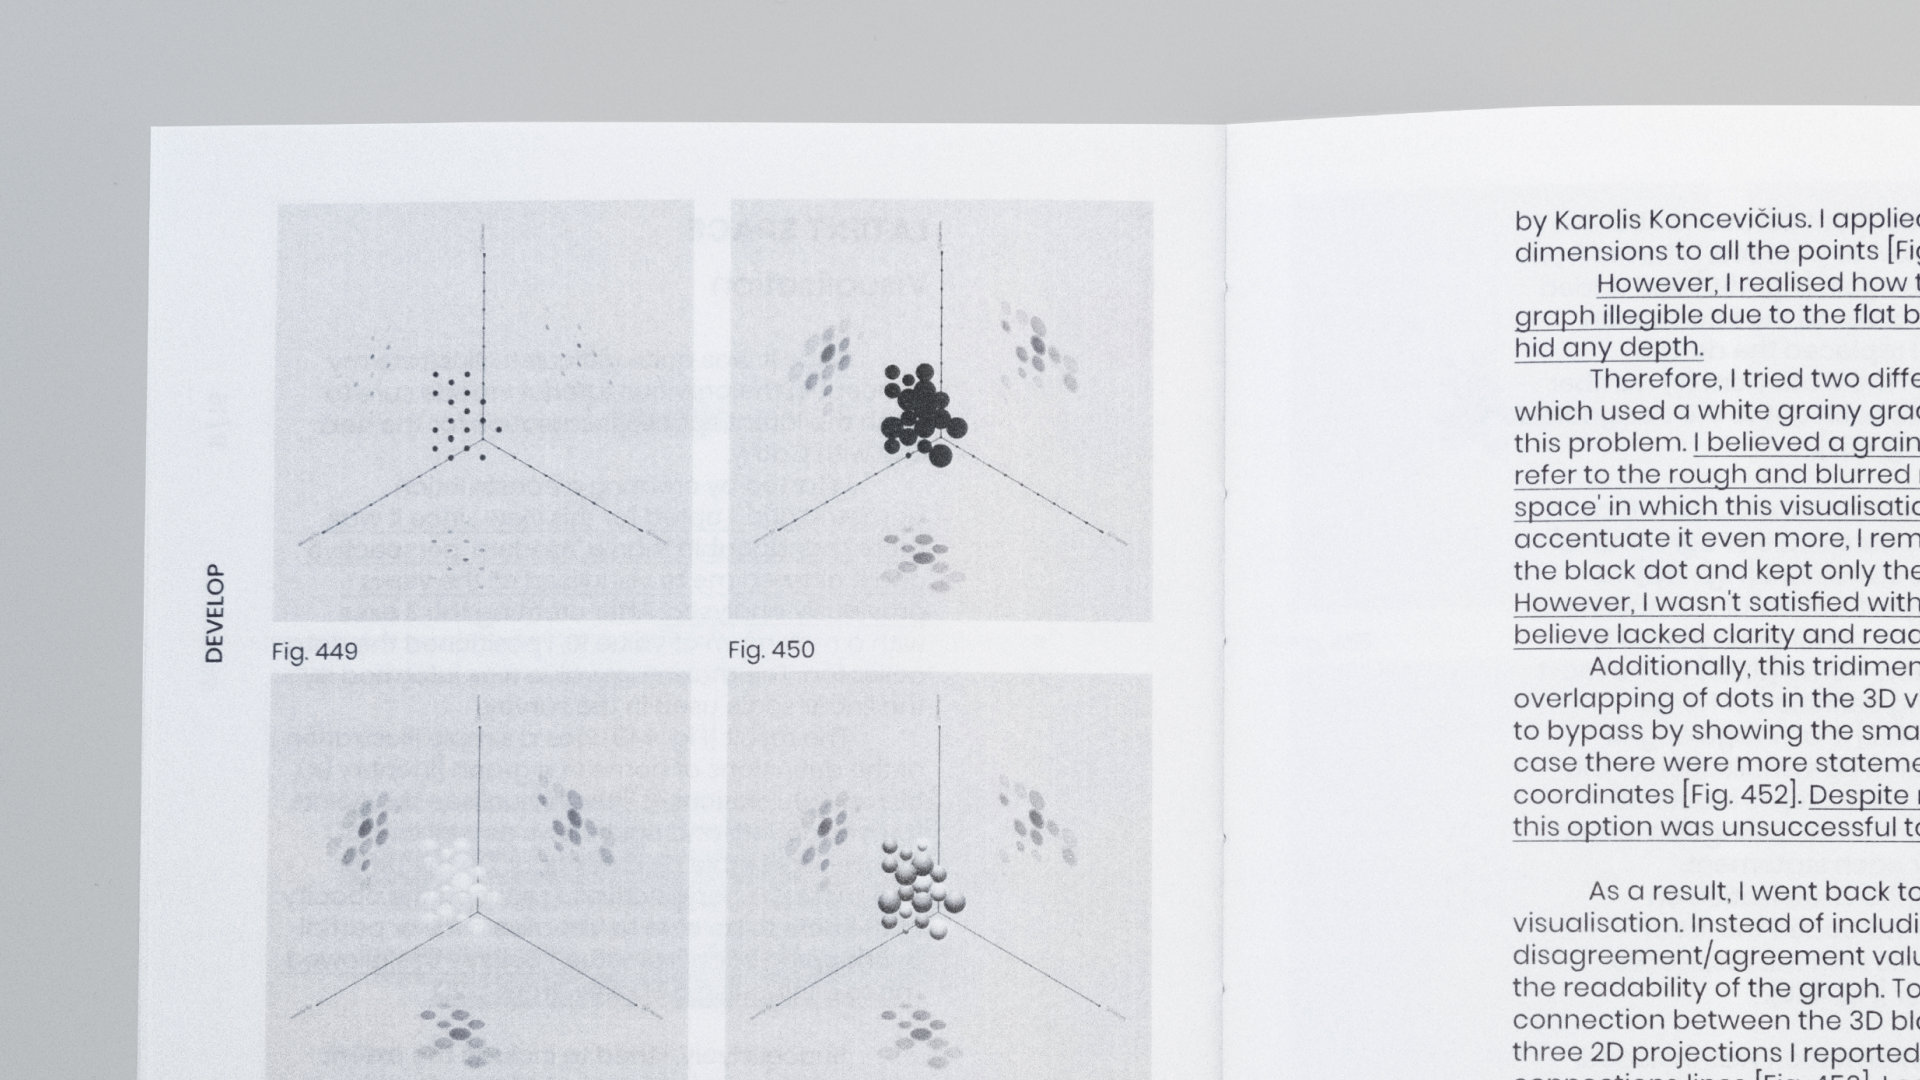
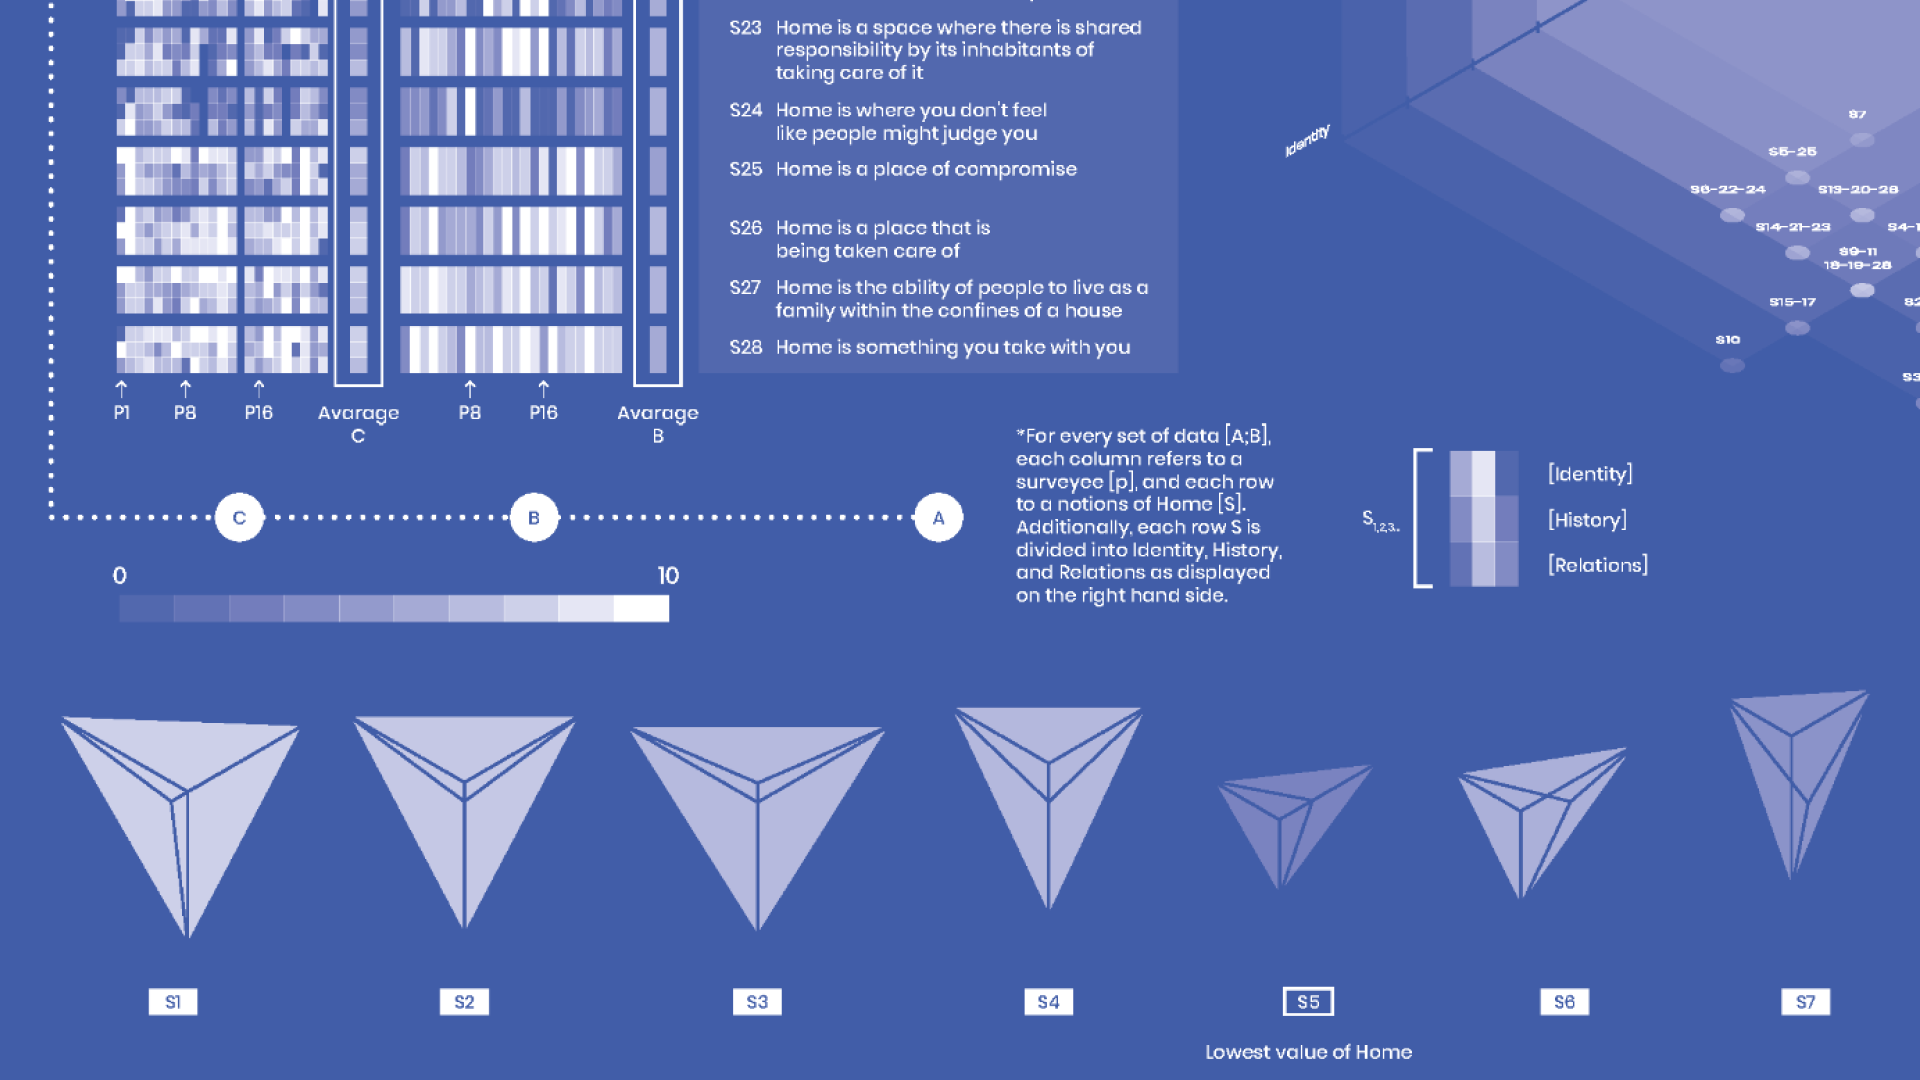
With the research framework and parameters defined, development focused on exploring how to transform the dataset into an expressive, legible visual model. Early experiments tested different ways of representing the data spatially, from simple scatter plots to more complex isometric grids. Color, point size, and opacity were iteratively refined to communicate agreement levels and make clusters stand out clearly.
Solution
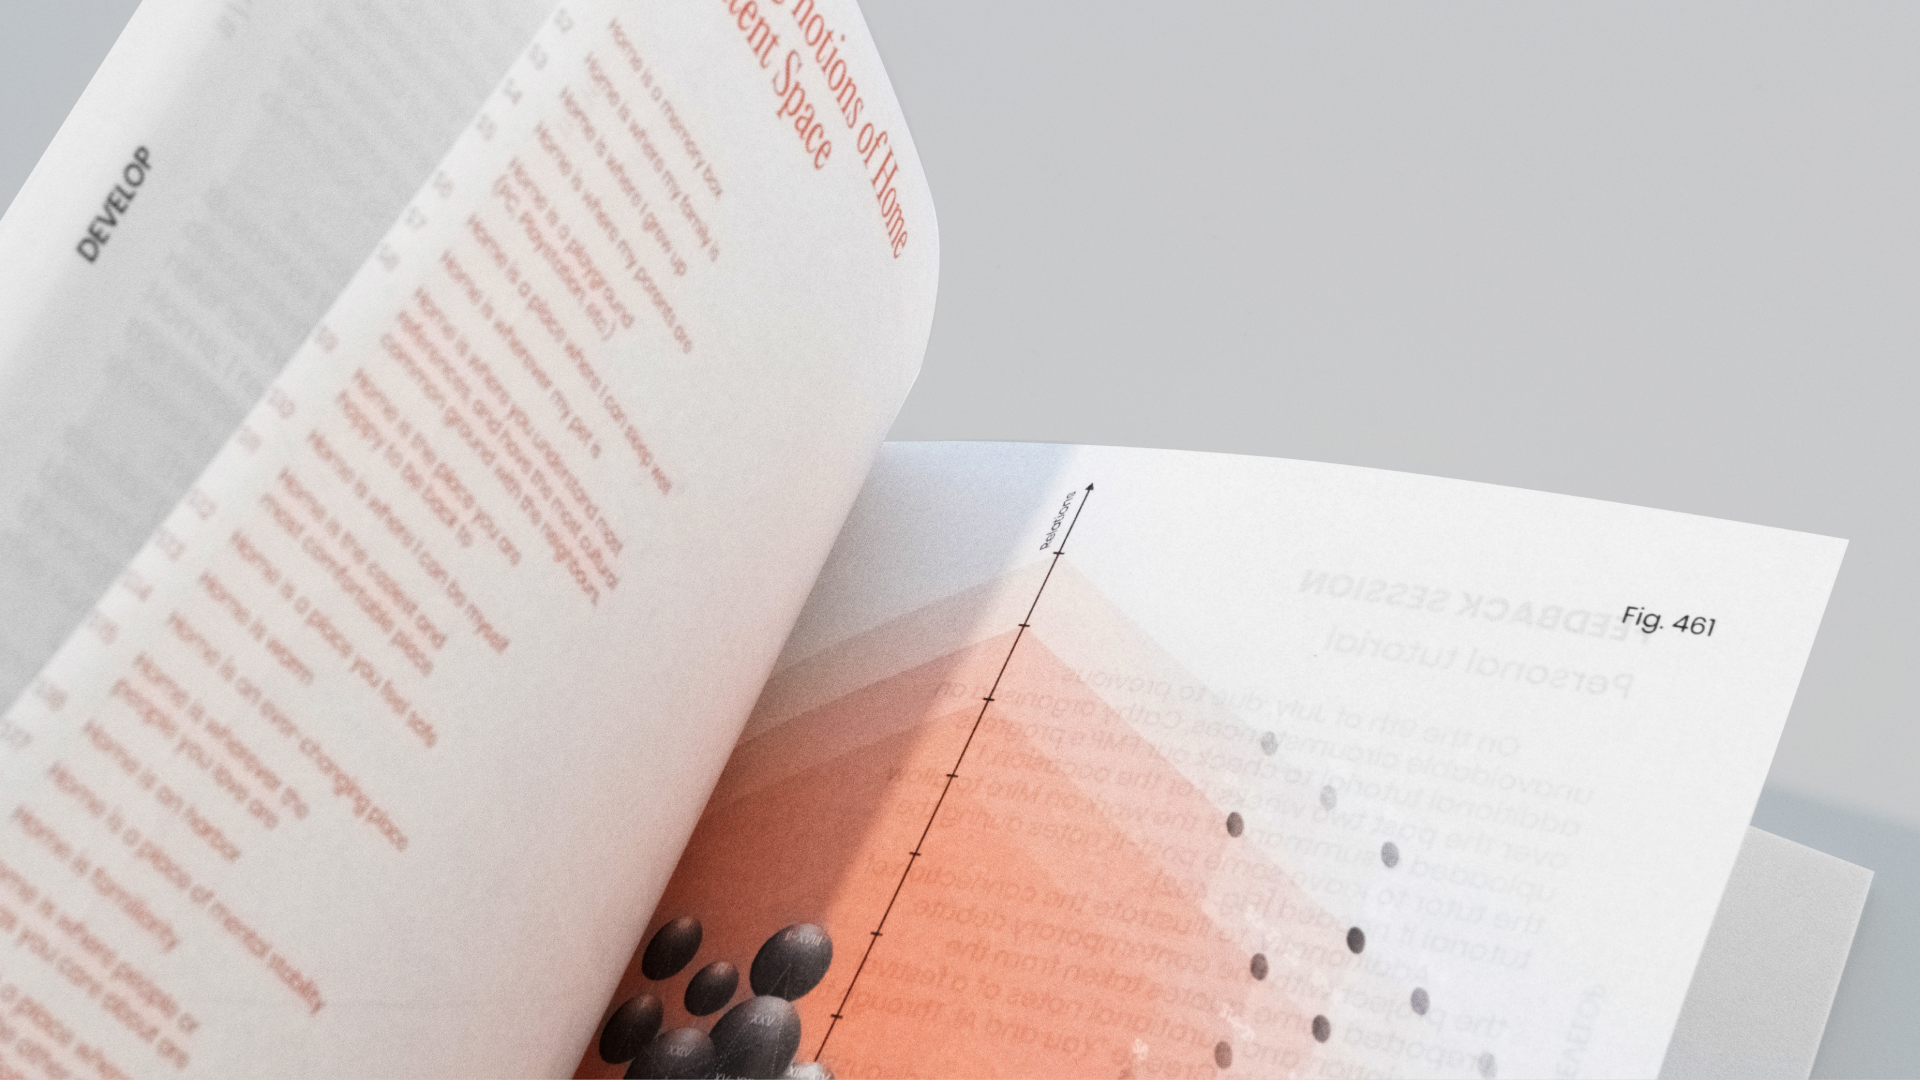
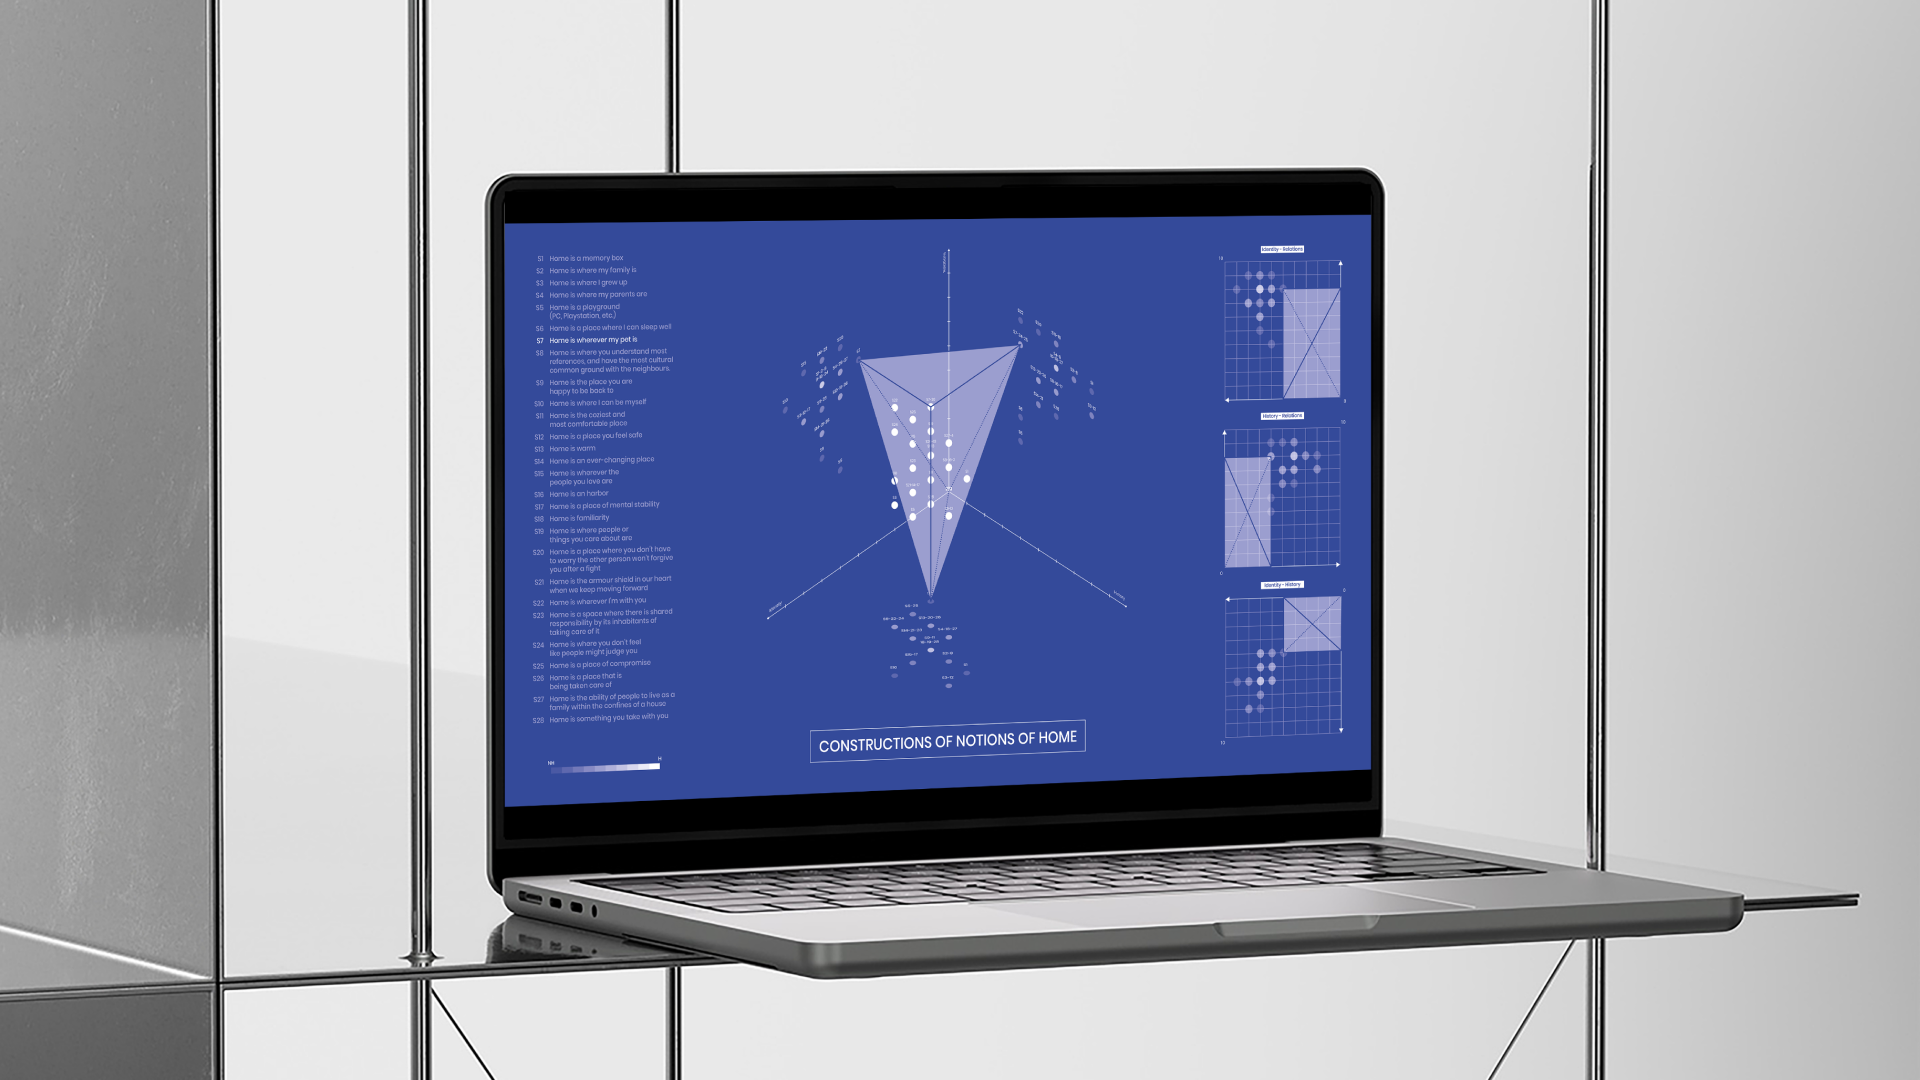
The final outcome is a visual blueprint that represents participants’ definitions of home. Each definition was plotted in a three-dimensional coordinate system, with identity, history, and relations as the axes. Multiple views — top, side, and isometric — make the data legible from different perspectives.
Similar definitions of home naturally group together in the latent space, allowing the audience to see patterns and overlaps that might otherwise remain hidden. By scaling and adjusting the opacity of the data points according to participant agreement, the visualization becomes a tool for comparing and interpreting how different individuals and communities construct their sense of home.
Credits
Claudia Chiavazza as part of the Final Major Project at MA Communication Design – Graphic Design, Kingston University (2020–21)